Key Takeaways
- Silver has established a robust support level of around $22, with initial resistance levels at $23.5, $24.4, and around $25.
- The demand for silver continues to be strong, driven by significant growth in key sectors like photovoltaic energy, 5G technology, and electric vehicles, which are increasing their consumption of this precious metal.
- The prospect of a soft landing for the economy and the ongoing strength of the US economy could be favourable for silver, given the metal’s substantial industrial demand.
The price of silver shows signs of consolidation, while the industrial sector supports demand for the precious metal.
In the first few weeks of 2024, silver has built a solid support zone just above $22, rebounding to $23 and showing interesting consolidation signals. Looking ahead, we’ll delve deeper into the current market scenario and examine the key drivers that could influence silver prices in March 2024.
Macroeconomic Scenario
February saw a continuation of the risk-on sentiment in the markets, with many indices, including the S&P 500, achieving new all-time highs. The US economy remains robust, and investors are still betting on a soft landing after two years of high-interest rates. This optimism could be a favourable factor for silver, especially given its significant industrial demand.
Moreover, the price of silver has continued to show resilience in a scenario of high rates and high bond yields and could benefit from the anticipated easing of monetary policy expected in the coming months. Indeed, according to a large majority of analysts, central banks are expected to cut rates by around 100 basis points (1%) by the end of 2024.
Silver Technical Analysis
The current technical analysis shows some positive signals, with the price showing signs of consolidation. Notably, a strong support zone has been established just above the $22 mark, with a rebound reaching between $23 and $23.5.
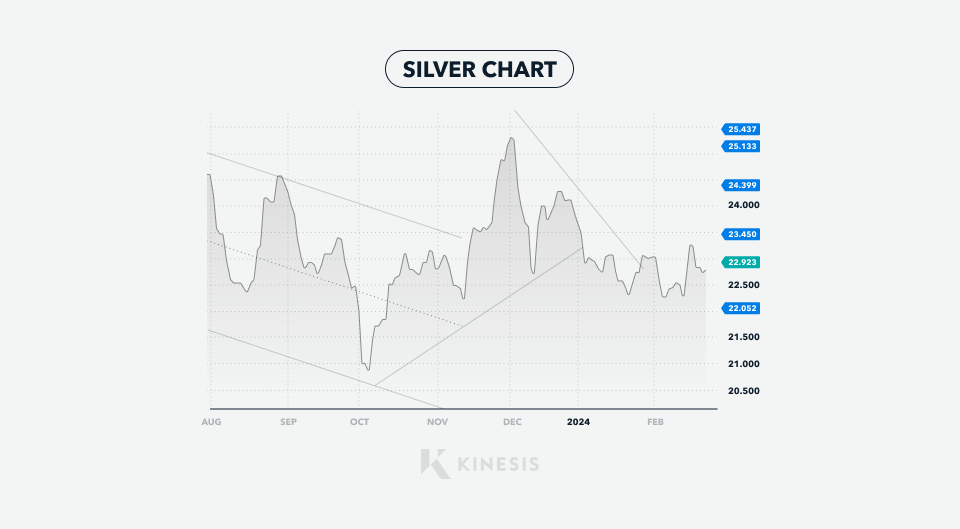
From a technical point of view, we can see a double bottom at $22, which could represent a positive reversal pattern. Additionally, the price of silver broke through the bearish trendline set in the early weeks of the year. A clear surpass of the resistance level of $23.5 could push more investors to return to the buying side.
Should this upward trend persist, the next resistance levels are at $24.4, $25.05, $25.4, and around $26, corresponding to the double top achieved in April and May of the previous year. Conversely, a drop below the $22 support zone would signal a weakening trend, opening space for a further decline in the price of silver.
Physical Silver Demand
Overall, the physical demand for silver remains strong, with some key sectors progressively increasing their demand. Notable sectors include photovoltaic energy, electric vehicles, and 5G technology.
In terms of pricing, silver is significantly cheaper than gold, with the silver-to-gold ratio currently exceeding the historical average. This price differential also extends to the investment sphere, where silver appears undervalued compared to gold. This valuation gap could further bolster the demand for silver.
The Gold/Silver Ratio
The gold-to-silver ratio, a metric that reflects the number of ounces of silver needed to purchase one ounce of gold, is currently hovering around 90. This level is significantly higher than the 20-year average of about 68. This disparity suggests that silver is currently priced relatively low in relation to gold.
Citations
- https://www.reuters.com/markets/rates-bonds/global-markets-rate-cuts-analysis-pix-2023-11-30/
- https://www.cnbc.com/2023/11/07/central-banks-look-to-have-hit-peak-rates-heres-how-markets-think-theyll-come-down.html
Carlo is an external market analyst for Kinesis Money. With a credential background in Economic Finance and International Exchange (MA), Carlo’s critical analysis of gold and silver markets’ performance is frequently quoted by leading publications such as Forbes, Reuters, CNBC, and Nasdaq.
This publication is for informational purposes only and is not intended to be a solicitation, offering or recommendation of any security, commodity, derivative, investment management service or advisory service and is not commodity trading advice. This publication does not intend to provide investment, tax or legal advice on either a general or specific basis.
Read our Editorial Guidelines here.