The precious metals sector has had a big run since November 3rd, with gold up 8.7%, silver up 10% and GDX up 21% (through to November 16th).
The sector is due for what I believe will be a mild pullback. In fact, I would welcome a shallow pullback to consolidate the big move, reset the momentum indicators (RSI/MACD) and thereby set up the next move higher.
For the better part of this year, the prices of gold and silver have been moving in correlation with the directional movement of the stock market. When the market heads lower, the hedge funds have been shorting gold and silver COMEX futures, along with SPX futures. They cover some portion of their shorts when the market bounces.
This chart shows this relationship:
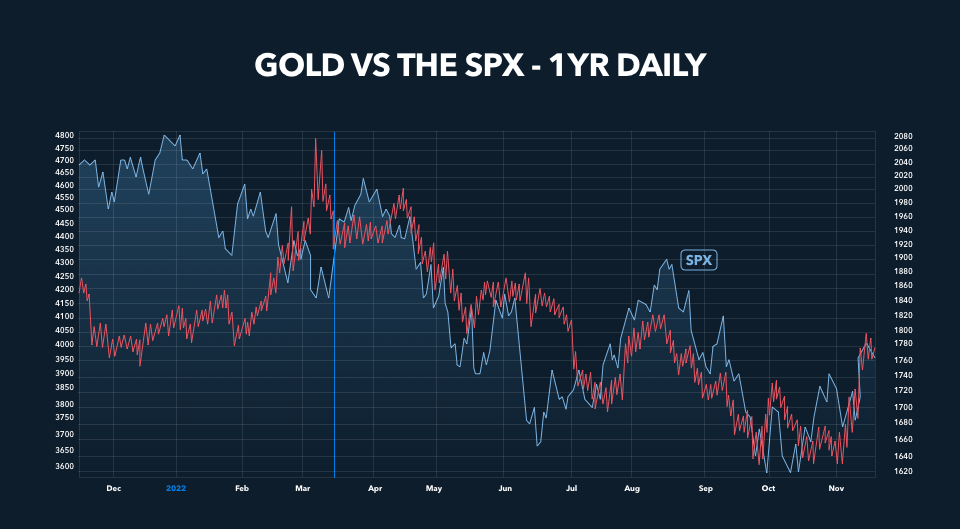
The chart above plots the price of gold (shown by the red line) vs the S&P 500 (shown by the blue line) over the last year. The two markets were mildly inversely correlated up until mid-March (blue vertical line). After mid-March, the two markets have been moving almost in lock-step. I recall vividly thinking to myself in mid-April that the decline in the precious metals had become its most intense at any time since the precious metals sector downtrend began in August 2020. I also believe that this amplification of the selling in the sector might be the final leg to a bottom.
The fact that the hedge funds were shorting COMEX gold and silver futures starting in the spring can be tied to the weekly CME Commitment of Traders (“COT”) report. The Managed Money COT segment (hedge funds/CTAs) has been dumping gold and silver gross long positions and adding to gross short positions. The COT report showed that the Managed Money cohort went net short on COMEX silver futures in July and net short on COMEX gold futures in August.
In the past 20 years, mostly though not in all cases, when the Managed Money COT cohort has been net short on COMEX futures, it has signalled the end of a decline in gold and silver. While the Managed Money cohort has been net short paper silver several times over the last 20 years, it is rare when the cohort is short on both gold and silver COMEX futures – like now.
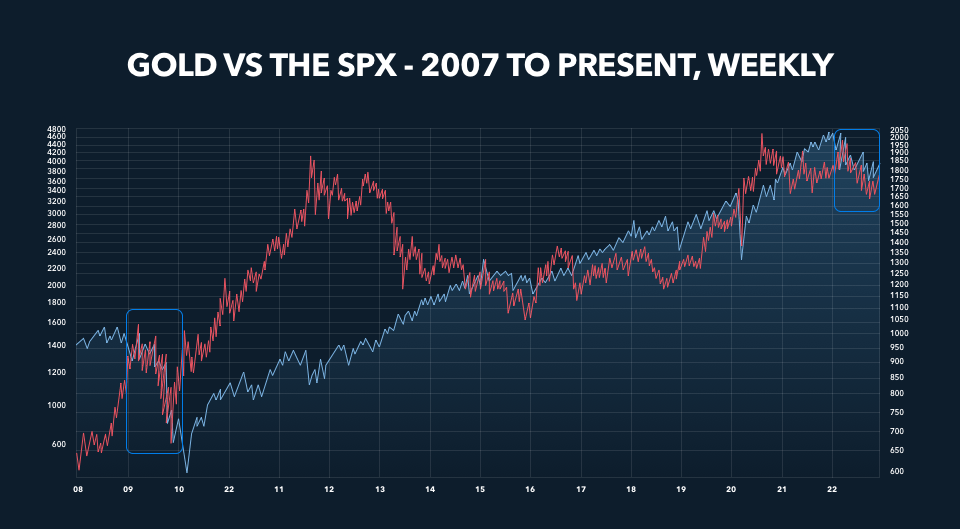
Circling back to the correlation between the stock market and the prices of gold and silver, the correlation illustrated in the chart above occurred in the final move to a bottom in the precious metals sector in the spring/summer of 2008.
The chart below shows the gold price vs the S&P 500 from 2007 to the present on a weekly basis:
This publication is for informational purposes only and is not intended to be a solicitation, offering or recommendation of any security, commodity, derivative, investment management service or advisory service and is not commodity trading advice. This publication does not intend to provide investment, tax or legal advice on either a general or specific basis.


