The sell-off in the precious metals sector, which I will argue is primarily an officially sanctioned bullion bank market intervention, with some help from momentum-based hedge fund algo programs, is startlingly similar to the September/October 2008 decline.
Echoes of the 2009 Financial Crisis
The financial markets, banking system and economic backdrop are remarkably similar to their condition in 2008, except this time, adverse variables that could lead to a system meltdown like 2008 are more powerful. It is likely that they’ll lead to a more severe stock and credit market melt-down than the financial crisis.
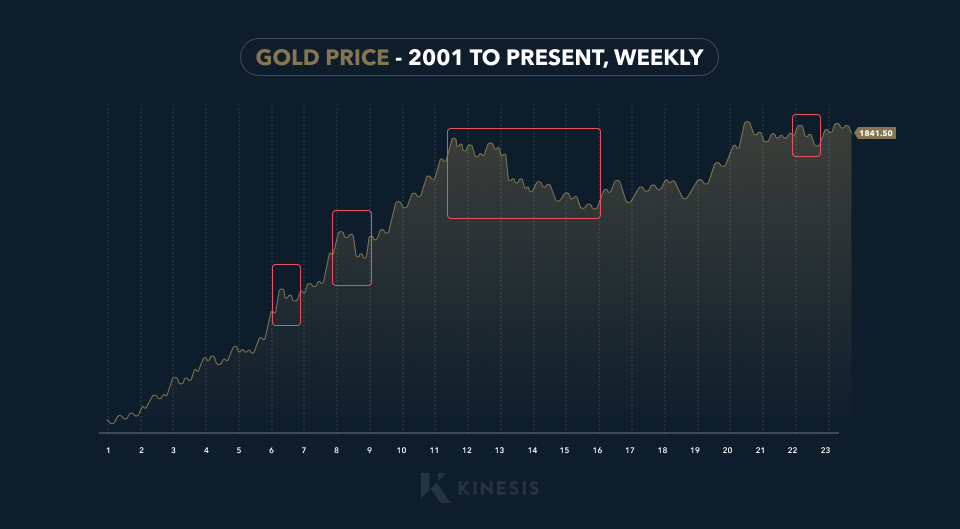
Despite the sharp decline in gold and silver over the past several weeks, relative to 2008 both metals are holding up remarkably well:

The chart above shows the price of gold from 2001 to the present on a weekly basis. The price declines in 2006, 2008, late 2011 – late 2015 and early 2020, were much bigger on a percentage decline basis than has been experienced in the recent price decline. To be sure, it’s impossible to know if there will be more pain in gold and silver or if a bottom is forming.
While the condition of the economy, credit markets and banking system – all of which are transitioning into a state of distress – is remarkably similar to 2008, there are factors helping to support the precious metals sector. These were not present in 2008.
The most significant is the enormous demand for physical gold from Eastern Hemisphere central banks and investors. In fact, according to the World Gold Council Eastern central bank gold buying hit a record high in the first half of 2023.
Eastern Hemisphere Boosting Demand for Gold
It is well-known that China has been accumulating gold in massive quantities for a long time. Alasdair Macleod, who has done exhaustive research on this topic, believes China has been buying since the 1980s. China imported a record amount of gold in 2022, and its rate of import has carried over to 2023. Add to that, Indian buying was present in 2008, while the country has been a consistent importer of 800-1,000 tonnes of gold annually.
Data from China’s Shanghai Gold Exchange shows that delivery volume in August increased 40% over July. The SGE is an accurate measure of domestic gold demand because every kilogram of gold that is purchased by investors/retail is required to be processed through the SGE, which is operated by the Peoples Bank of China.
With gold price premiums in China hitting a record high in September, this is partly attributable to temporary curbs placed on gold importation to halt the outflow of yuan and also as a function of rabid domestic retail demand. After China announced the removal of the import curbs, the price premium dropped, but remained above the long-term average premium, indicating that buying remains strong.
Central Bank Moves: A Closer Look at 2023
Many other countries in the Eastern hemisphere, have been aggressively buying gold for the last couple of years. The World Gold Council reported that central bank buying continued at a strong pace in August, citing Turkey, Poland, China and Uzbekistan as the most prominent buyers.
In addition, Singapore emerged in 2023 as a large accumulator of physical gold. Also, Saudi Arabia and the United Arab Emirates stepped up their respective gold purchases in 2023. The UAE has become one of the largest gold trading hubs in the world. In 2022, the UAE imported 96.4 tonnes of gold from Russia, which represented one-third of Russia’s gold production.
After suspending its gold purchases from the local markets in March 2020 to conserve cash after war sanctions were imposed, the Bank of Russia (Russia’s central bank) announced in 2022 that it would resume accumulating gold.
Several African countries have announced over the summer that their central banks have initiated a program of buying gold from local gold mining producers to bolster the quality of their respective foreign reserves. Note that West Africa as a territory is the second largest gold-producing region in the world.
Both gold and silver, and particularly gold, have held up well relative to significant precious metals sector declines in the last twenty-three years and I contend that it’s because of the global demand for physical gold. The real pain in the sector has been endured by the mining stocks, which are historically cheap relative to the price of gold (GDX/gold ratio) and extraordinary value relative to stocks and bonds.
Technical Outlook: Gold’s Potential Rebound
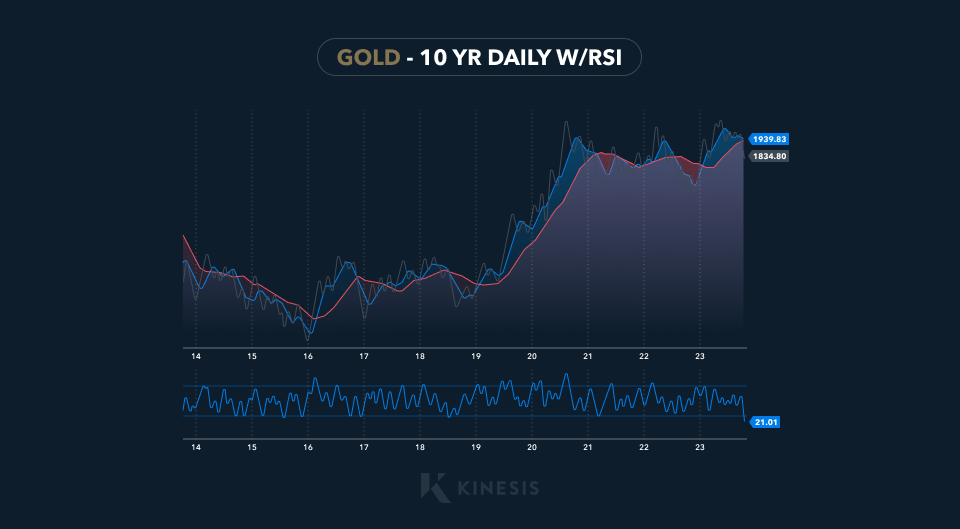
From a technical standpoint, based on the RSI as a measure of an oversold or overbought technical condition, gold is more oversold than at any time in the last 10 years:

The only time in the last 10 years that the RSI has registered a reading this low was in late 2015, late 2016 and late 2018. Subsequent to hitting that reading on the RSI, the precious metals sector embarked on significant rallies.
In addition to the similarities between late 2008 and now, it’s my view that the technical and fundamental variables point to the potential for a big move higher that could start anytime between and year’s end.
Dave Kranzler is a hedge fund manager, precious metals analyst and author. After years of trading expertise build-up on Wall Street, Dave now co-manages a Denver-based, precious metals and mining stock investment fund.
This publication is for informational purposes only and is not intended to be a solicitation, offering or recommendation of any security, commodity, derivative, investment management service or advisory service and is not commodity trading advice. This publication does not intend to provide investment, tax or legal advice on either a general or specific basis. The opinions expressed in this article, do not purport to reflect the official policy or position of Kinesis.
Read our Editorial Guidelines here.


